JavaScript Debugging
When we write code in any language. We follow some lcode language instructions. Sometime we miss small things from code. JavaScript debugging involves identifying and fixing these errors in your code. Debugging can be a time-consuming and frustrating process, but
There are several techniques and tools available to make it easier and more efficient.
Here are some important techniques for debugging JavaScript code:
1. Use console.log()
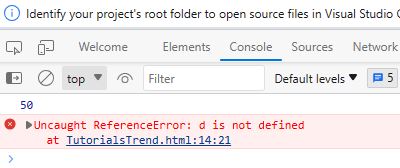
One of the simplest and most effective debugging techniques is to use console.log() to print out the values of variables and objects at various points in your code. This can help you identify where your code is going wrong and what variables are causing the issue.
<!DOCTYPE html>
<html>
<head>
<title></title>
</head>
<body>
<h2>TutorialsTrend - JavaScript Debugging Examples</h2>

<script>
a = 20;
b = 30;
c = a + b;
console.log(c);
console.log(d);//d is not intialized
</script>
</body>
</html>
To open the console on browser, press F12 key and check the error.
2. Use a debugger
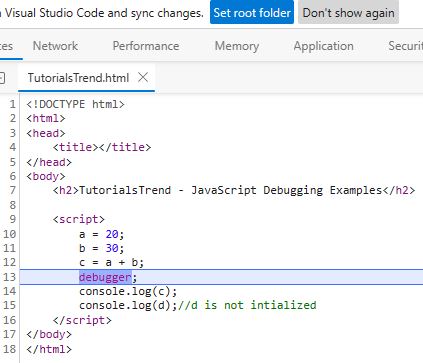
Most modern web browsers have built-in debugging tools that allow you to step through your code, set breakpoints, and inspect the state of your program. Using a debugger can be a powerful tool for identifying and fixing errors in your code.
<!DOCTYPE html>
<html>
<head>
<title></title>
</head>
<body>
<h2>TutorialsTrend - JavaScript Debugging Examples</h2>

<script>
a = 20;
b = 30;
c = a + b;
debugger;
console.log(c);
console.log(d);//d is not intialized
</script>
</body>
</html>
The debugger stops the execution of the program at the position it is applied. Now, we can start the flow of execution manually. If an exception occurs, the execution will stop again on that particular line.
3. Use breakpoints
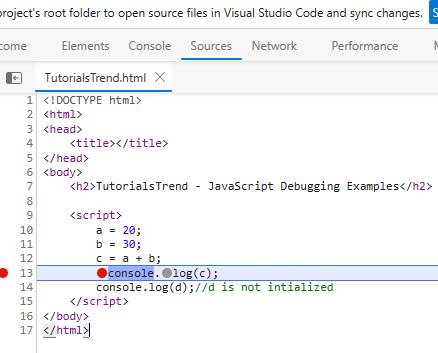
Breakpoints allow you to pause the execution of your code at a specific line of code and inspect the state of your program. Most modern web browsers have built-in debugging tools that allow you to set breakpoints and step through your code line by line.
4. Check your syntax
Syntax errors are a common cause of bugs in JavaScript code. Make sure to check your syntax carefully, and use a code editor or linting tool to catch any errors.
5. Use try-catch blocks
Try-catch blocks allow you to catch and handle errors in your code. By wrapping your code in a try-catch block, you can identify and handle errors in a more graceful way.
6. Use a code editor
A good code editor can make debugging easier by highlighting errors and providing helpful suggestions. Look for a code editor with syntax highlighting, code completion, and debugging tools.
By using these techniques and tools, you can make the debugging process easier and more efficient, and write more reliable and robust JavaScript code.
Here, we will find out errors using built-in web browser debugger. To perform debugging, we can use any of the following approaches:
Prev Next